Performance is a critical aspect of any software application that aims to reach a large audience. Even a minimal failure in an application’s performance can result in significant losses for a company. For instance, a five-minute downtime of Google.com in 2013 was estimated to cost the search giant as much as $545,000.
Therefore, it is essential to perform Quality Assurance and test the speed, response time, stability, reliability, scalability, and resource usage of software applications under specific workloads. Performance testing helps identify and eliminate performance bottlenecks in software applications.
Over the years, I have been involved in various performance tests as a QA Engineer, and through experience I’ve learned that Return on Investment (ROI) is one of the most important aspects of performance testing strategy.
While conducting tests for an important government agency, we discovered that despite the use of modern frameworks and cloud architecture there were still bottlenecks in the applications. One of the most significant issues we found was related to a form that sent a JSON with approximately 20MB of data. Under high concurrency, this JSON was causing the server to crash. Upon further investigation, we found that the JSON was storing all information on the form, including unselected options for countries, states, cities, and other fields. After resolving this issue, the size of the JSON was reduced to just 500kb, and the server was able to handle high concurrency without any problems. We estimated that the app would receive around 100,000 forms with a potential loss of $1 per form not successfully received, so our ROI for this app was around $95,000.
There are different types of performance testing, including load testing, stress testing, endurance testing, Pyke testing, volume testing, and scalability testing. Each of these tests checks the application’s ability to perform under various anticipated user loads, extreme workloads, long periods, sudden large spikes in load, large amounts of data in a database, and effectiveness in scaling up to support an increase in user load.
Even though cloud-based applications come with high standards for performance infrastructure, it is essential to check the application for any bottlenecks within the code that could cause issues at a larger number of users.
Common performance issues include long initial load time, poor response time around transactions, poor scalability, and bottlenecking. Therefore, performance testing is a critical aspect of the software testing process.
Here are some steps for the design and implementation of performance tests:
- Become familiar with your testing environment — Know your physical test environment, production environment, and what testing tools are available within your infrastructure.
- Identify the performance acceptance criteria — This includes goals and constraints for throughput, response times, and resource allocation.
- Plan & design performance tests — Determine how usage is likely to vary between end-users and identify key scenarios to test for all possible use cases.
- Configure the test environment — Prepare the testing environment before execution. Also, arrange tools and other resources.
- Implement test design — Create the performance tests according to your test design.
- Run the tests — Execute and monitor the tests.
- Analyze, tune and retest — Consolidate, analyze and share test results. Then fine-tune and test again to see if there is an improvement or decrease in performance.
To find a bottleneck, you can use different strategies, such as uploading a file, sending a form, loading a crowded homepage, testing with different sets of configurations, and checking for hardware weaknesses.
Some of the tools available for performance testing include WebLOAD, LoadNinja, HeadSpin, ReadyAPI Performance, LoadView, Keysight’s Eggplant, Rational Performance Tester, Loadrunner and Apache JMeter. Let’s explore how to set this last one up, together.
How to set up a basic load test in JMeter:
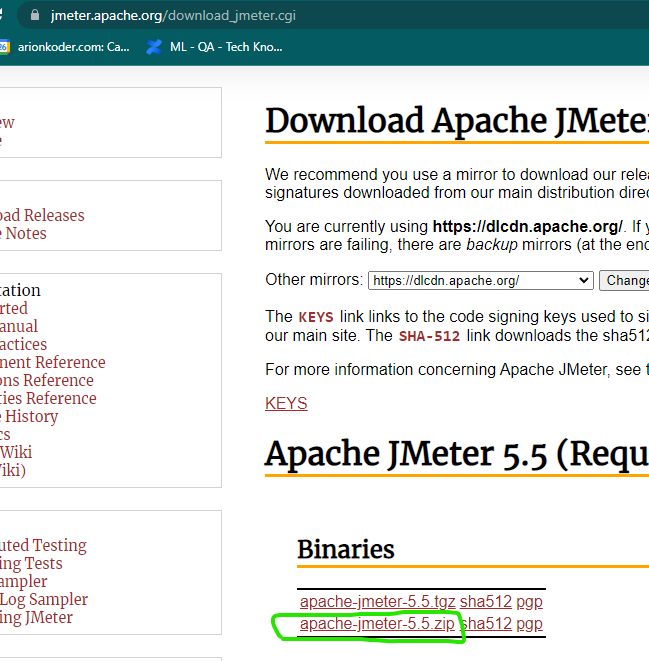
- Download and install JMeter: You can download JMeter from the official Apache JMeter website. Once you have downloaded the zip file, extract it to your preferred location. Make sure you have Java 8 or above installed on your machine.
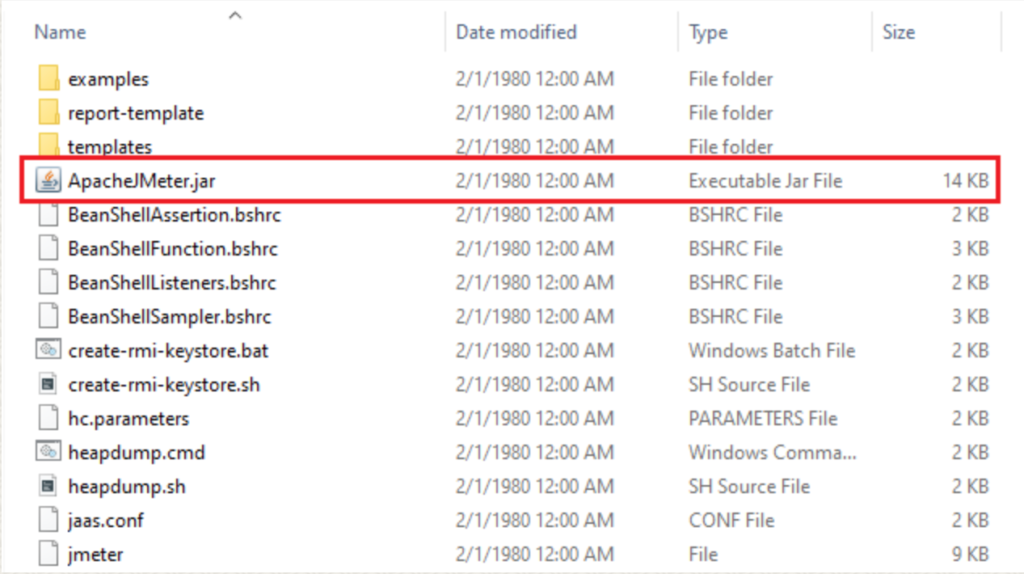
Open JMeter: To open JMeter on Windows, go to the bin folder in the extracted folder and double-click on the ApacheJMeter.jar file. On Mac, you can use the “jmeter” command in Terminal to open JMeter. On Windows it looks like this:
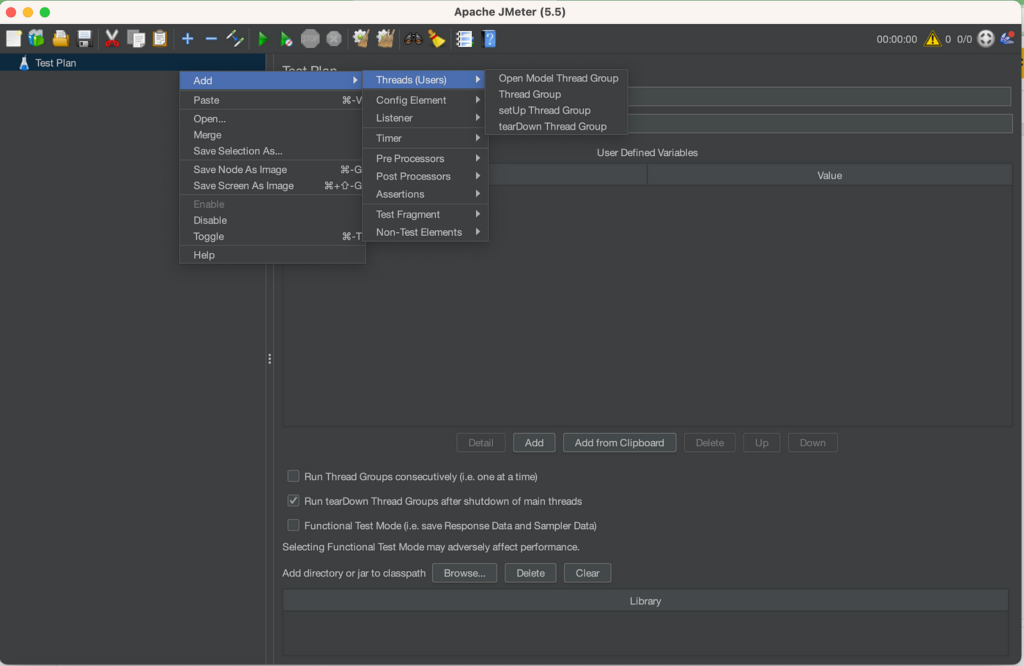
Create a Test Plan: In JMeter, a Test Plan is a container for all the test elements. To create a new Test Plan, right-click on the “Test Plan” element in the left panel and select “Add” > “Threads (Users)” > “Thread Group”. You can then set the number of threads (users) and ramp-up time for your test.
Add Samplers: Samplers are used to simulate user actions in your test. To add a Sampler, right-click on the Thread Group and select “Add” > “Sampler” > “HTTP Request”. In the “Server Name or IP” field, enter the URL of the website or API you want to test.
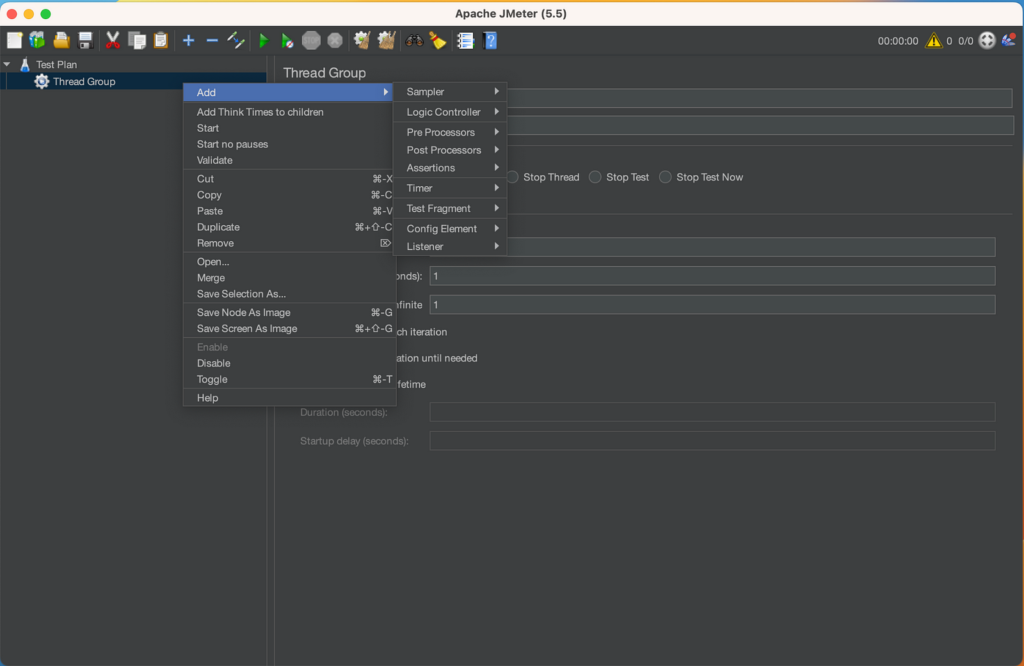
Add Listeners: Listeners are used to view the test results. To add a Listener, right-click on the Thread Group and select “Add” > “Listener” > “View Results in Table”. You can then run your test by clicking on the green “Play” button in the top toolbar.
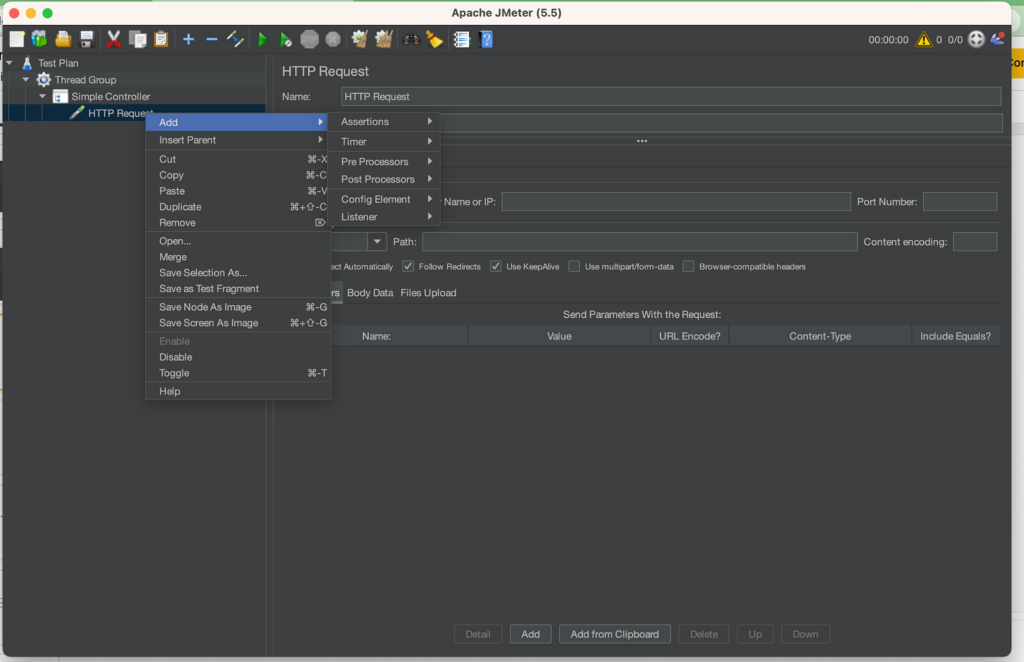
Analyze the Results: Once the test is complete, you can view the results in the listener you added. You can also save the results to a file for further analysis.
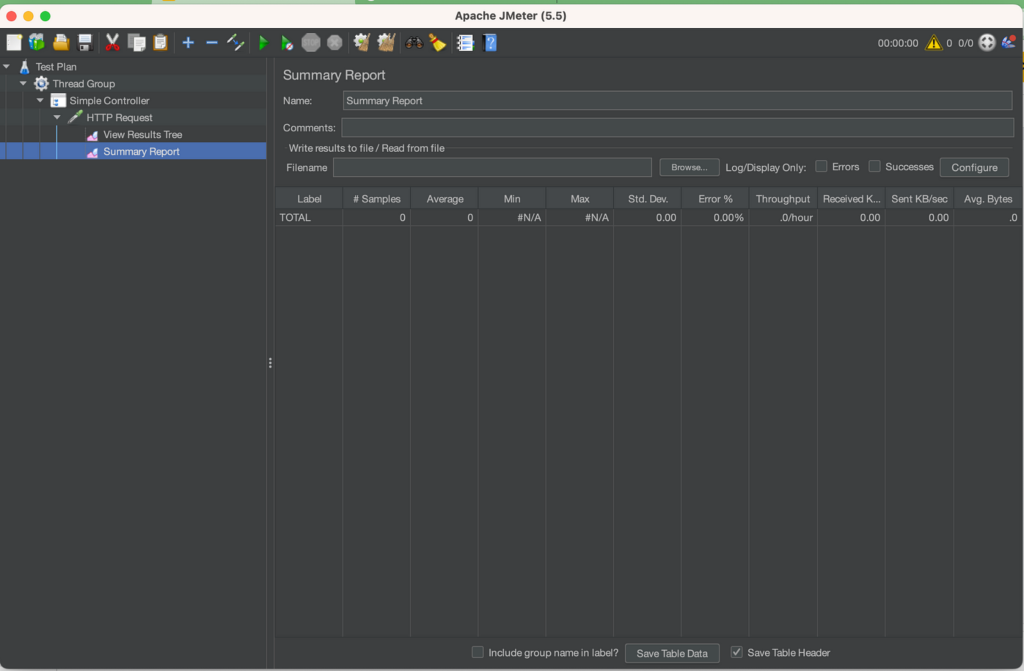
This is just a basic example of how to set up a load test in JMeter. There are many other elements you can use in JMeter to create more complex tests. Make sure to read the JMeter documentation to learn more about the tool and its capabilities.
In conclusion:
Performance testing is a critical aspect of the software testing process that helps identify and eliminate performance bottlenecks. By following the steps above and using the right tools, you can ensure that your software application performs well and avoids costly downtime.
Resources: